 FAIMS

Potential fishing zones
PFZ has two parts. One is an Android app, in Kiswahili and English, where fishers on the Tanzanian coast ask where to fish, check the weather, record what they caught and trade fish. The other is a satellite pipeline that reads sea temperature and chlorophyll along the coast every day and maps where the two line up.
- fishers signed up
- 536
- zone requests
- 2,145
- satellite zones mapped
- 1,926
- satellite days since
- Jun 2026
The fisher app
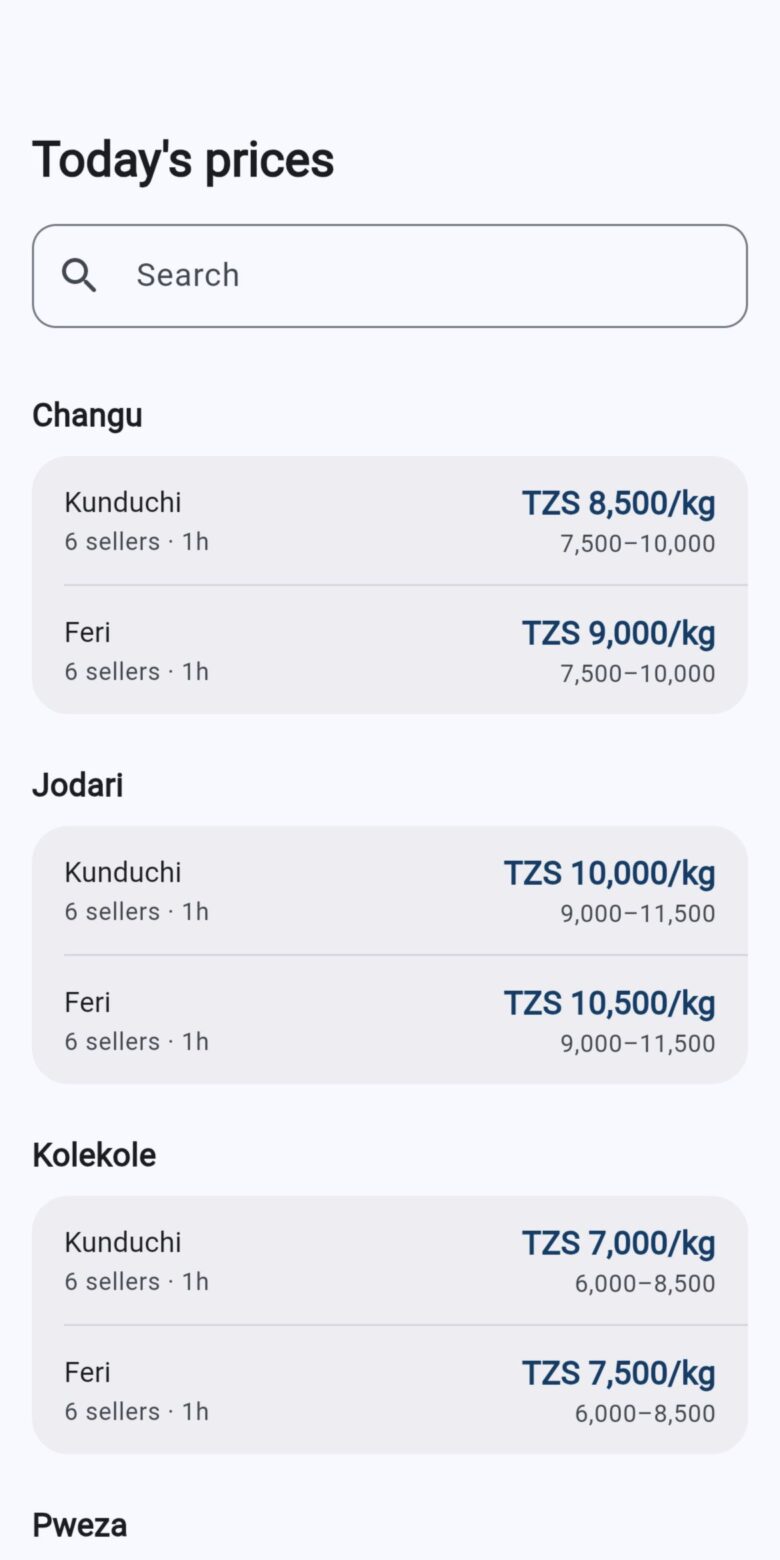
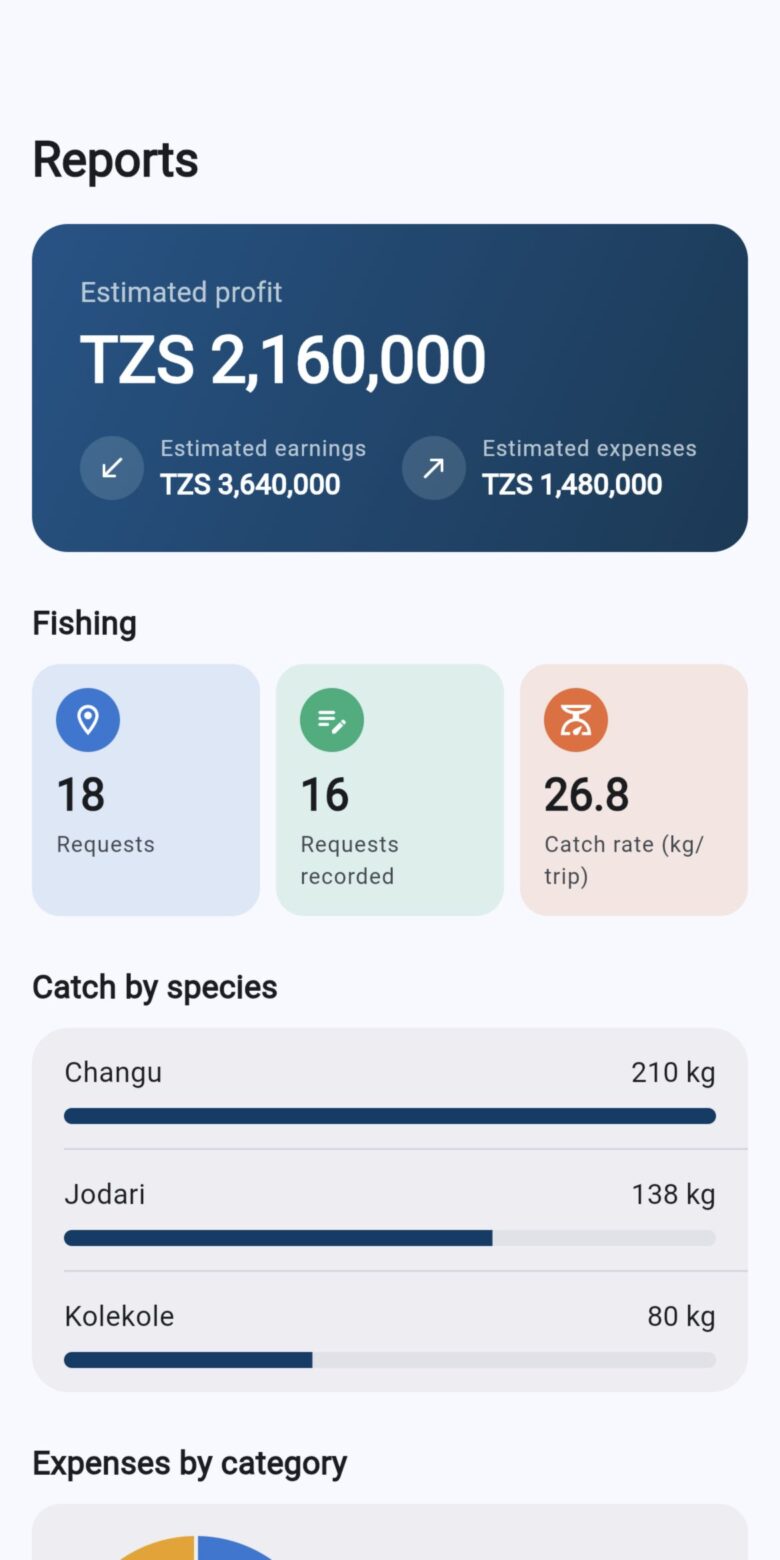
Fishers sign up with a phone number and a code sent by SMS. Before a trip they open “where to fish”, choose their district, landing site, boat, gear and how far they are willing to go, and get zones on a map with the distance to each and the weather there. After the trip they can log the fuel used, what it cost, and the species caught with their prices.
The same app has a market. A fisher or trader posts fish for sale with the category, how it was processed or dried, the market, the unit and the price, and buyers browse what is on offer nearby. Fishers keep a list of their vessels, and district officers can send bulk SMS to registered users from the web platform.
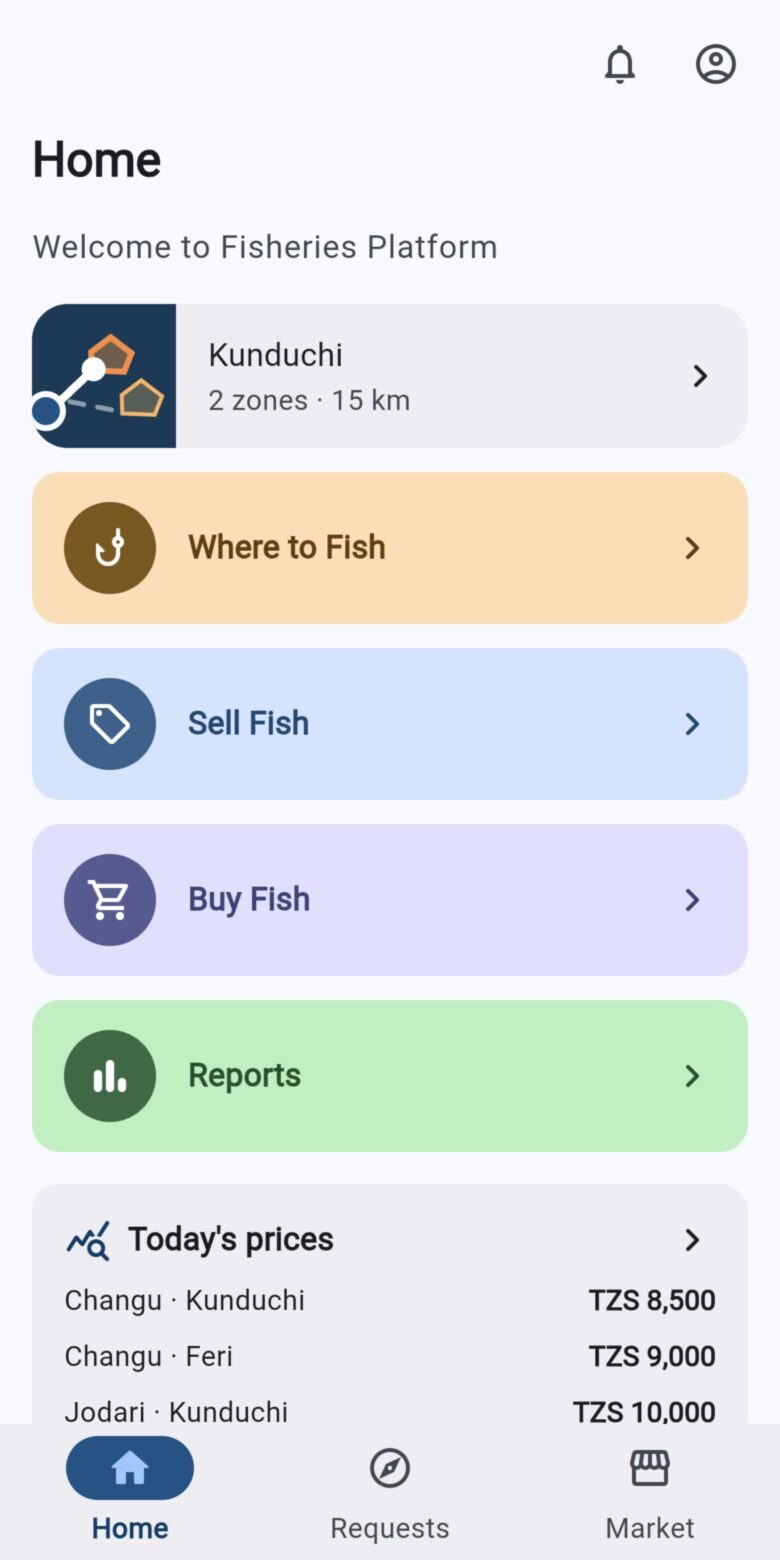
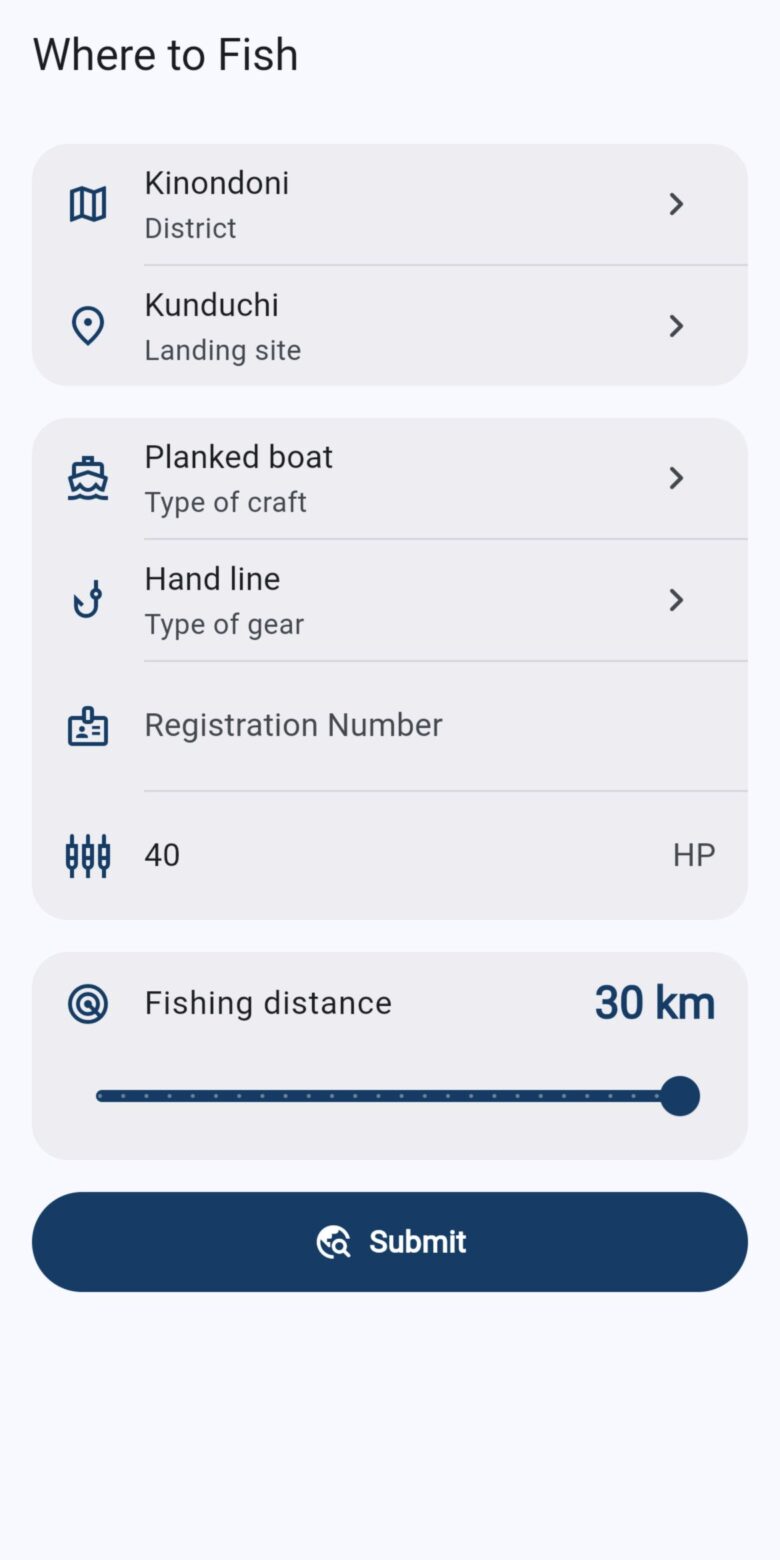
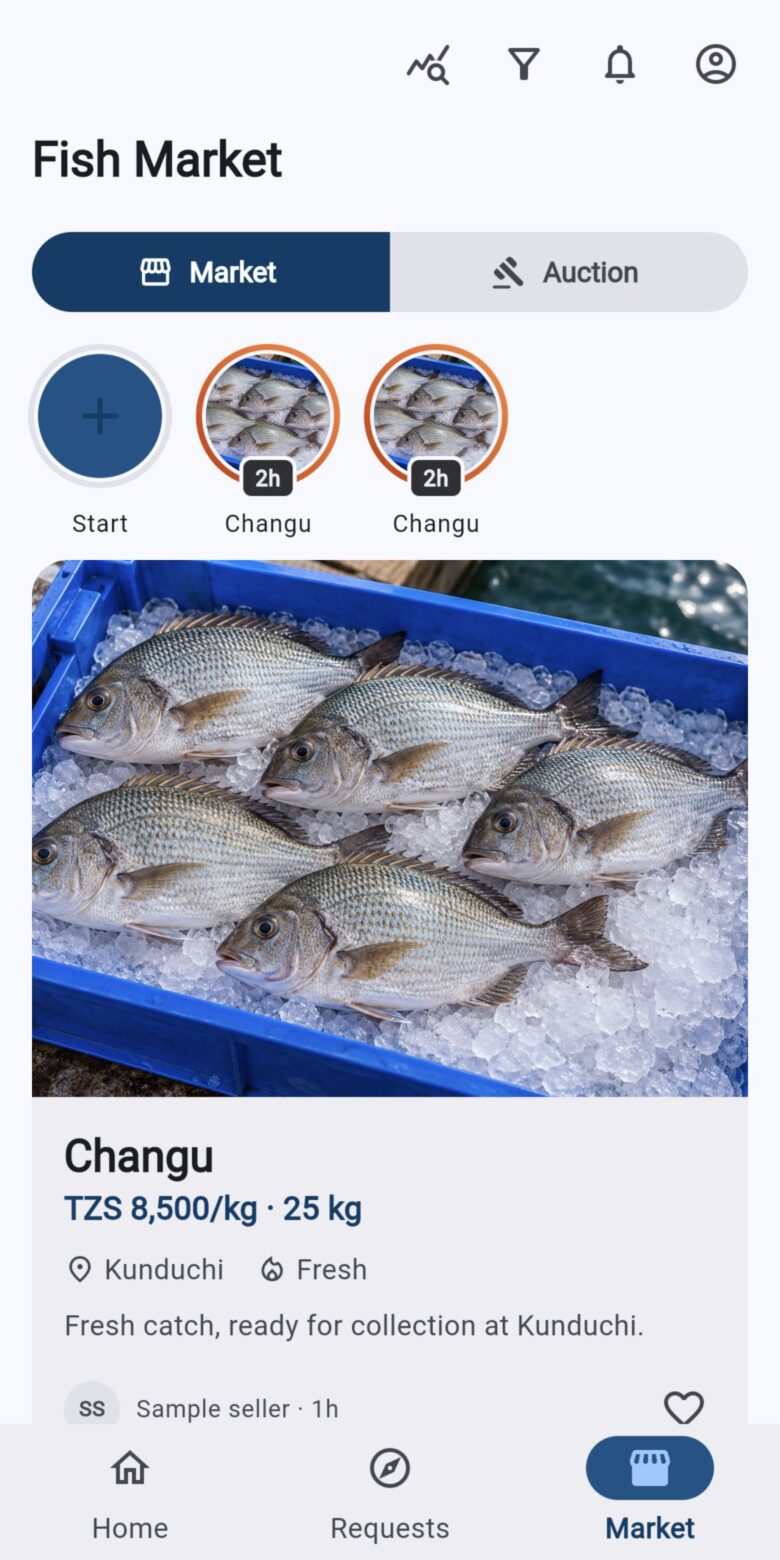
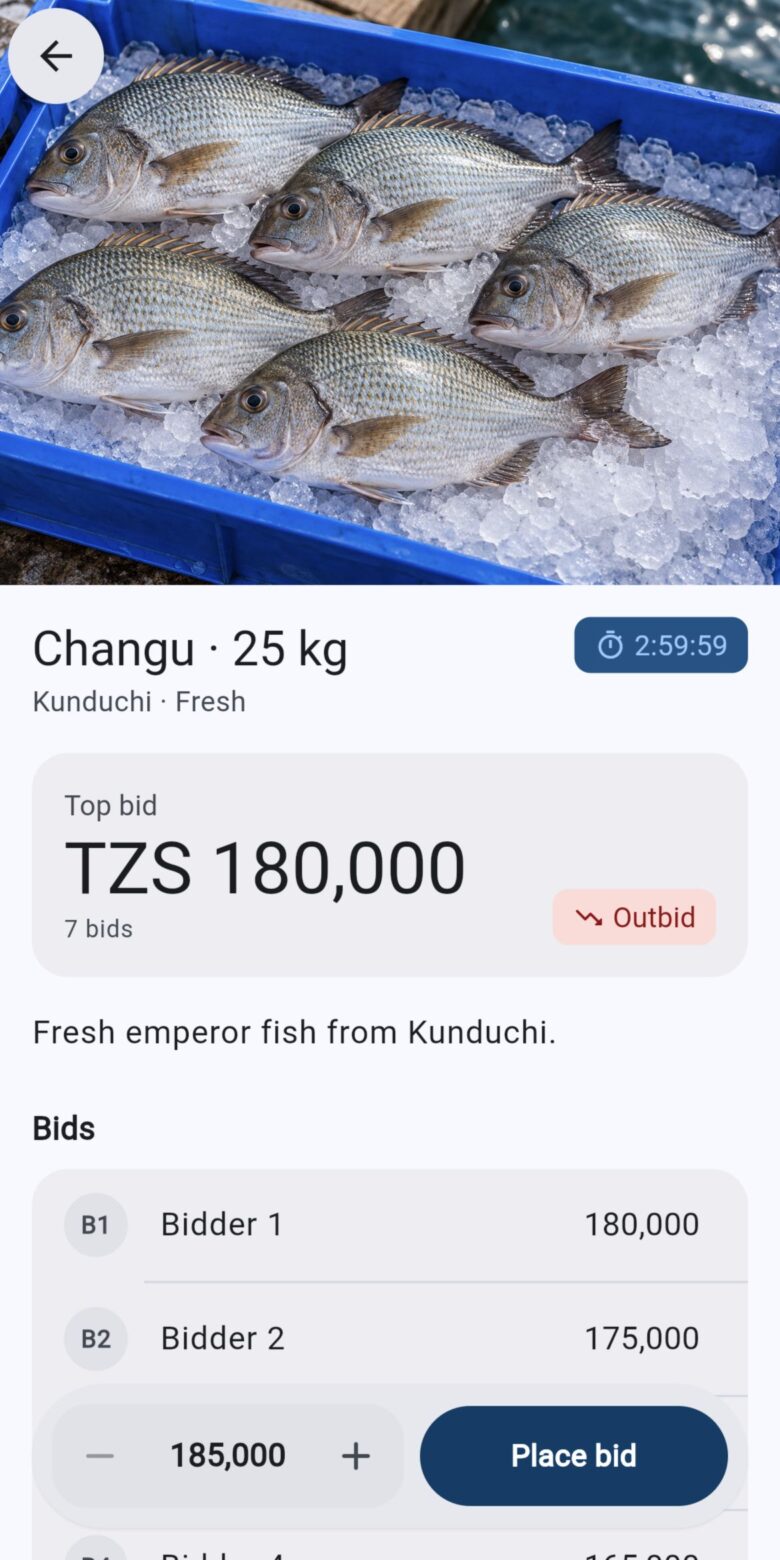
Where the app’s zones come from today
The zones a fisher sees in the app are drawn from a record of more than a million zone points mapped between 2015 and 2020. A request is matched to the same calendar day in that record and the zone groups nearest the landing site, within the chosen distance, are returned. That gives a reasonable seasonal picture, but not today’s sea. Switching the app to the daily satellite zones below is the next piece of work on PFZ.
Satellite data every day
Every day at 13:00 East Africa time FAIMS downloads products prepared for the Tanzanian coast by UST21. It walks back over the past seven days each time, because the feed arrives late and sometimes with gaps.
| Product | What it is | Typical delay |
|---|---|---|
| Sea surface temperature | Daily maximum from NOAA's optimum interpolation analysis (OISST), as a grid and a map image | About 2 days |
| Chlorophyll-a | Daily merged level-3 product, a measure of phytoplankton in surface water, as a grid and a map image | About 4 days |
| Vessel detections | Ships picked up by Sentinel-1 radar, with position and length. Kept for fisheries officers and not published | About 1 day |
The grid covers 38.2° to 43.0° east and 4.8° to 10.0° south at 0.01°, a little over a kilometre. That reaches from the Kenyan border to just short of Mtwara. Map images are kept for a year so earlier days can be viewed; the full grids are kept for two weeks, long enough to re-run zones with different settings.
Finding zones
Fish gather where cold and warm water meet and where there is food. A sharp change in sea temperature over a short distance, a thermal front, often marks upwelling or the edge of a current, and chlorophyll shows where phytoplankton is growing. A potential fishing zone is a place where both signals are strong on the same day.
-
Front strength
For each cell, the size of the temperature gradient: how fast temperature changes moving across the grid.
-
Candidate cells
Cells in the top 15% of front strength for that day that are also in the top 40% of chlorophyll. Thresholds are set from each day's own data, so they follow the seasons instead of fixed values.
-
Zones
Touching candidate cells, diagonals included, are joined. Groups smaller than 120 cells are dropped as noise.
-
Description and score
Each zone gets an outline, its area, mean temperature, mean and highest chlorophyll, mean front strength and a score that ranks it against the other zones that day.
- P85, P60
- 85th and 60th percentiles over that day's valid sea cells
- Chl̂, F̂, Â
- zone mean chlorophyll, mean front strength and area, each rescaled from 0 to 1 across that day's zones
The thresholds were tuned in August 2026 to give a handful of large zones a day, typically 3 to 13 averaging 380 to 950 km². Lower front thresholds merge the whole coastal upwelling band into one zone of 8,000 km² or more, which is no use to someone with a canoe and a day’s fuel.
The score only ranks zones within a day. It is not a probability of catching fish, and zones from two different days cannot be compared by score. Work is under way on how gaps in the satellite data are filled, since filling gaps can create a temperature edge that is not really there.
Results
Figures are refreshed from FAIMS every night. They are provisional and not for citation.
References
- Huang, B. and others (2021). Improvements of the daily optimum interpolation sea surface temperature (DOISST) version 2.1. Journal of Climate 34, 2923 to 2939.
- UST21. Daily sea surface temperature, chlorophyll-a and Sentinel-1 vessel detection products for the Tanzanian coast. Delivered to FAIMS since June 2026.