 FAIMS

 eAqUA
Aquaculture
eAqUA is the aquaculture side of FAIMS. It keeps a register of fish farms, hatcheries and feed producers, and a routine report from each one on what it stocked, fed, harvested and sold. Officers use it in the web platform or in its own Android app, with or without a signal.
- establishments registered
- 4,897
- regions with at least one
- 5
- routine reports filed
- 3,031
- first records
- Oct 2026
A register and a routine report
Capture fisheries have a long tradition of landing surveys. Aquaculture in the region mostly does not: farms are scattered, many are new, and production figures tend to come from occasional studies. eAqUA works with two forms that build up a record over time.
The inventory
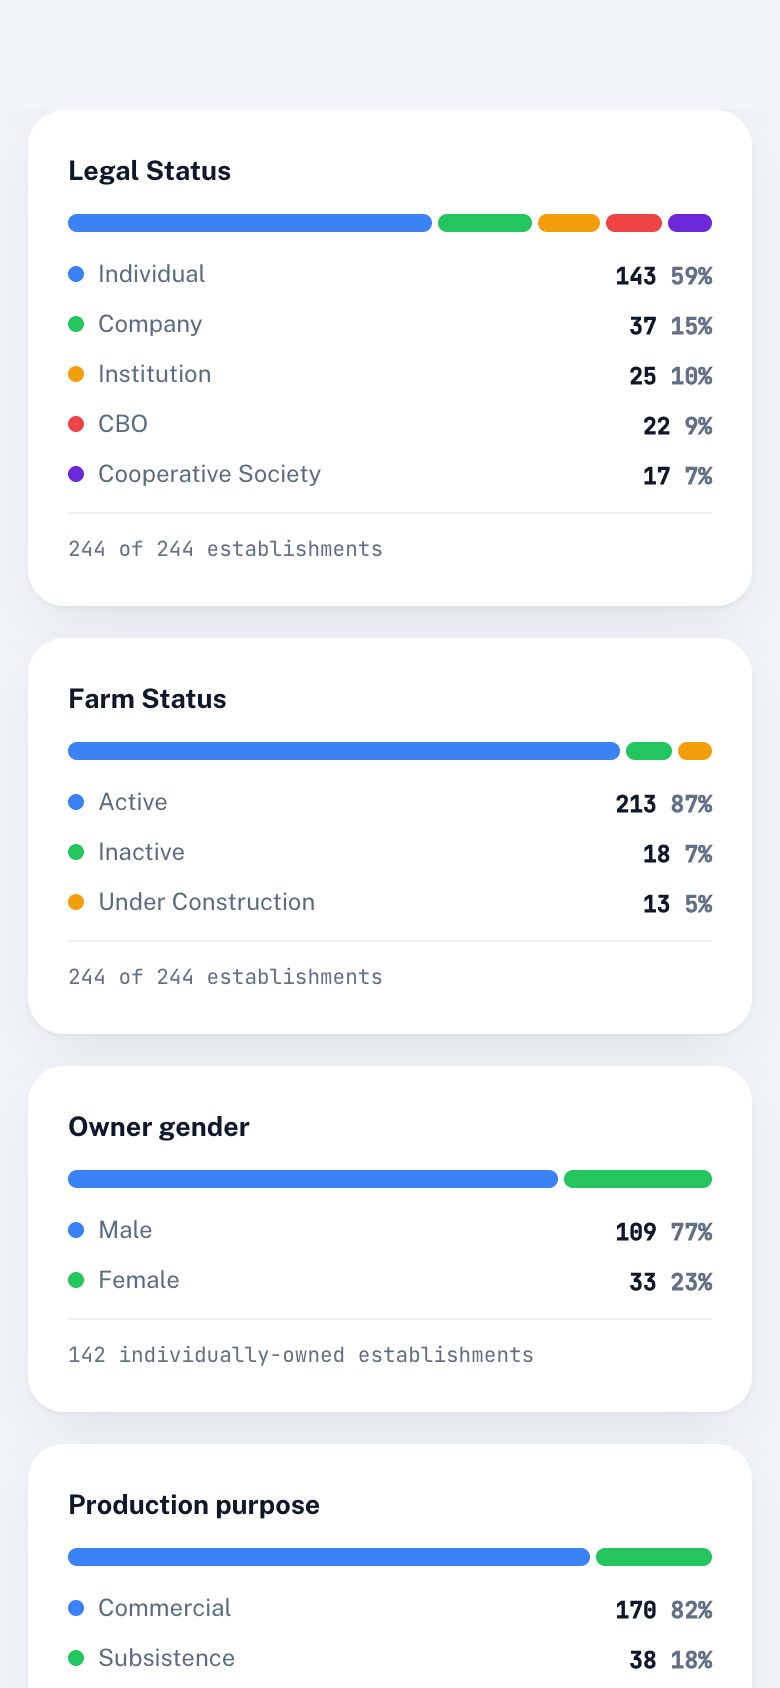
Each establishment is registered once, as a farmer, a seed producer (hatchery) or a feed producer. The form records who runs it and under what legal status, individual, company, cooperative, community group or institution, where it is, whether it is active, registered or under construction, whether a feasibility study was done, members and employees by age group, workers with disabilities, the species it produces and why, how it is managed, its water source, broodstock and yearly investments.
The routine report
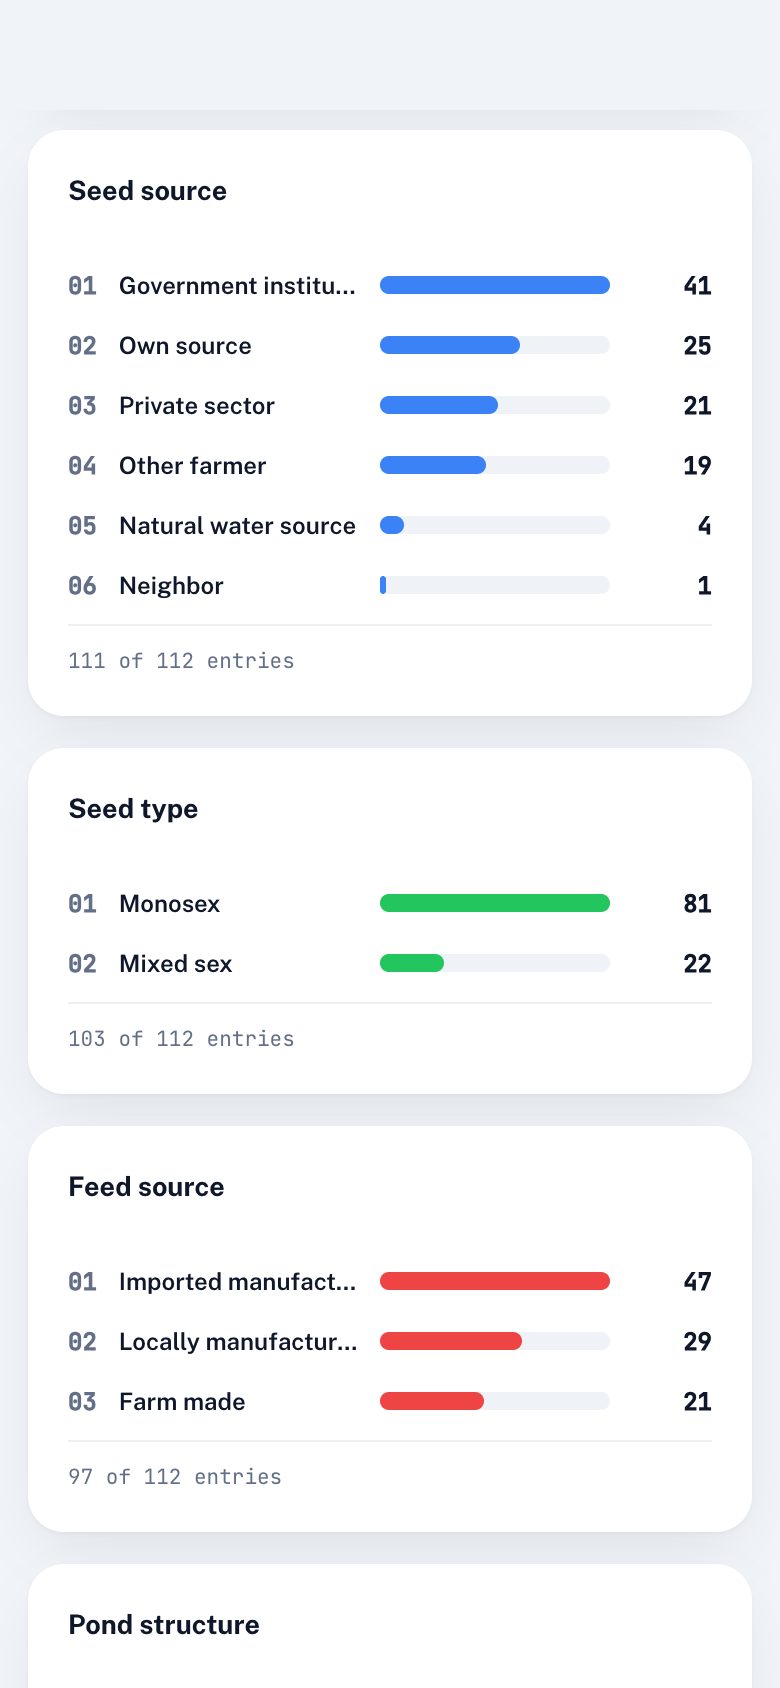
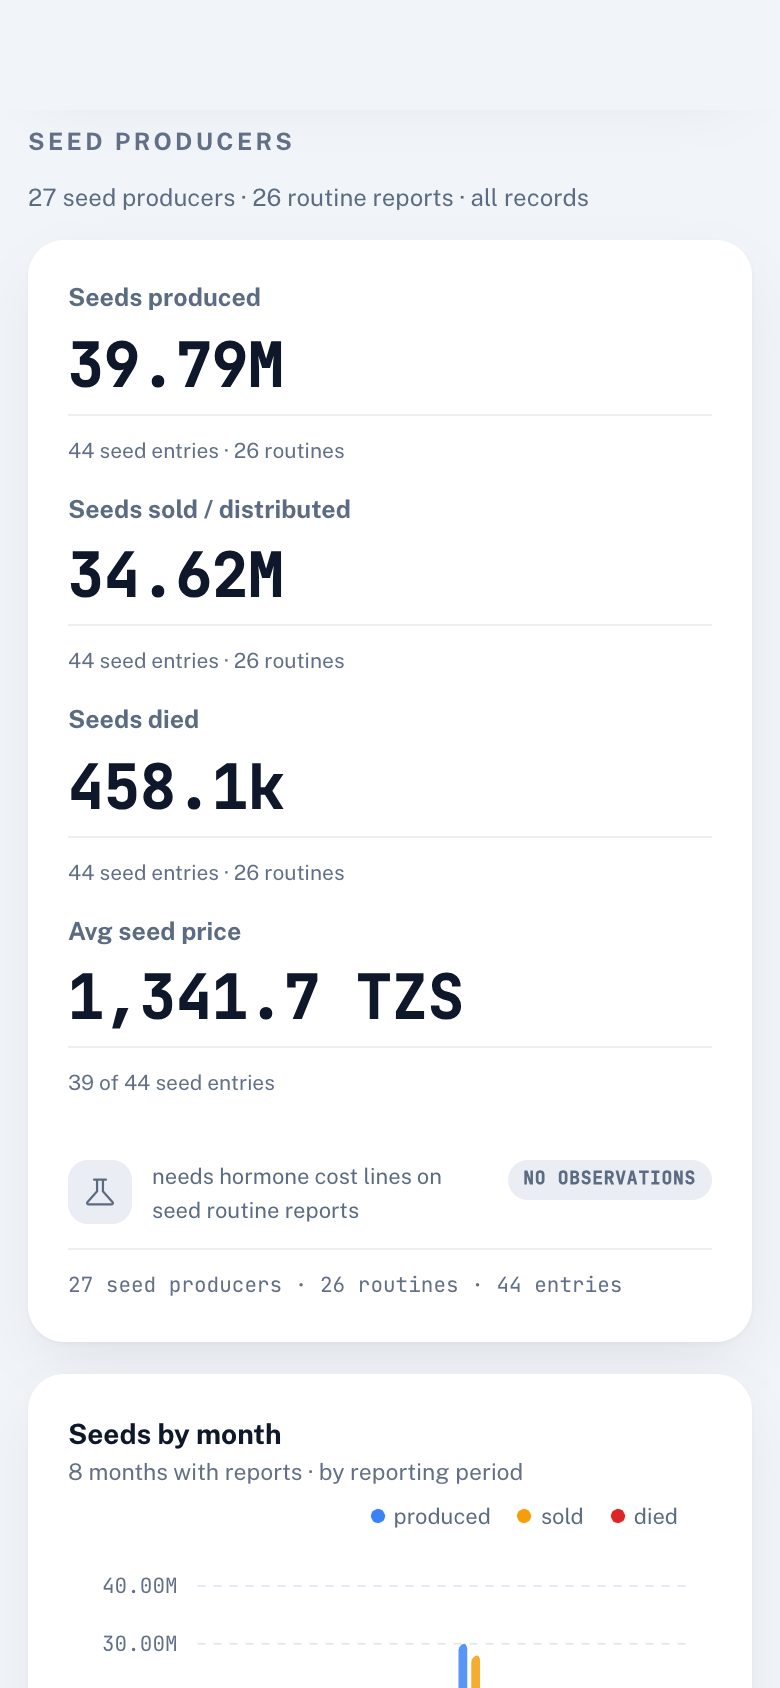
On each visit the officer picks the establishment on a map and reports per production unit: the system and species, the pond structure, how many units and how big, where the seed came from and what it cost, the feed used in each phase, production per cycle, sale price per kilogram, cycle length, every stocking event with the number stocked and the number that died, and running costs such as water, power, fuel, wages, transport and maintenance. Hatcheries report broodstock stocked and lost, seed produced, lost and sold, and the price per seed. Feed producers report feed type, quantity made and sold, and price.
Production systems
Every production unit belongs to one of eight systems. The system decides which questions the form asks: whether feed applies, whether seed is counted in fish or weighed in kilograms, and whether water is paid for.
| System | Typical use in the region |
|---|---|
| Pond | Earthen or lined ponds for tilapia and catfish |
| Cage | Floating cages, mostly tilapia on Lake Victoria |
| Pen | Enclosed areas of shallow water |
| Tank | Concrete or plastic tanks, often at hatcheries |
| RAS | Recirculating systems that filter and reuse water |
| Raceway | Long channels with flowing water |
| Rope | Seaweed on lines along the coast |
| Raft | Floating rafts for shellfish and seaweed |
Seaweed
Seaweed farmers think in ropes, not in hectares or fingerlings, so the form asks for what they know and FAIMS works out the rest.
The 0.12 kg is the weight of seaweed tied at each point on the line. Two species are flagged as seaweed: Kappaphycus, sold as cottonii, and Eucheuma spinosum.
Working offline
Many farms are out of reach of a mobile network. An officer may register a new farm in the morning and file its first production report an hour later, both without a signal. The app gives the new farm a temporary number, lets the report point to it, and on sync sends the register first, swaps the temporary number for the real one and then sends the report. The mapping is kept on the phone, so a sync that fails half way can pick up where it stopped.
eAqUA is built from the same code as the FAIMS app and shares its accounts and sync. On the web, supervisors switch the whole platform between the fisheries and aquaculture views from the navigation bar.
Dashboard and map
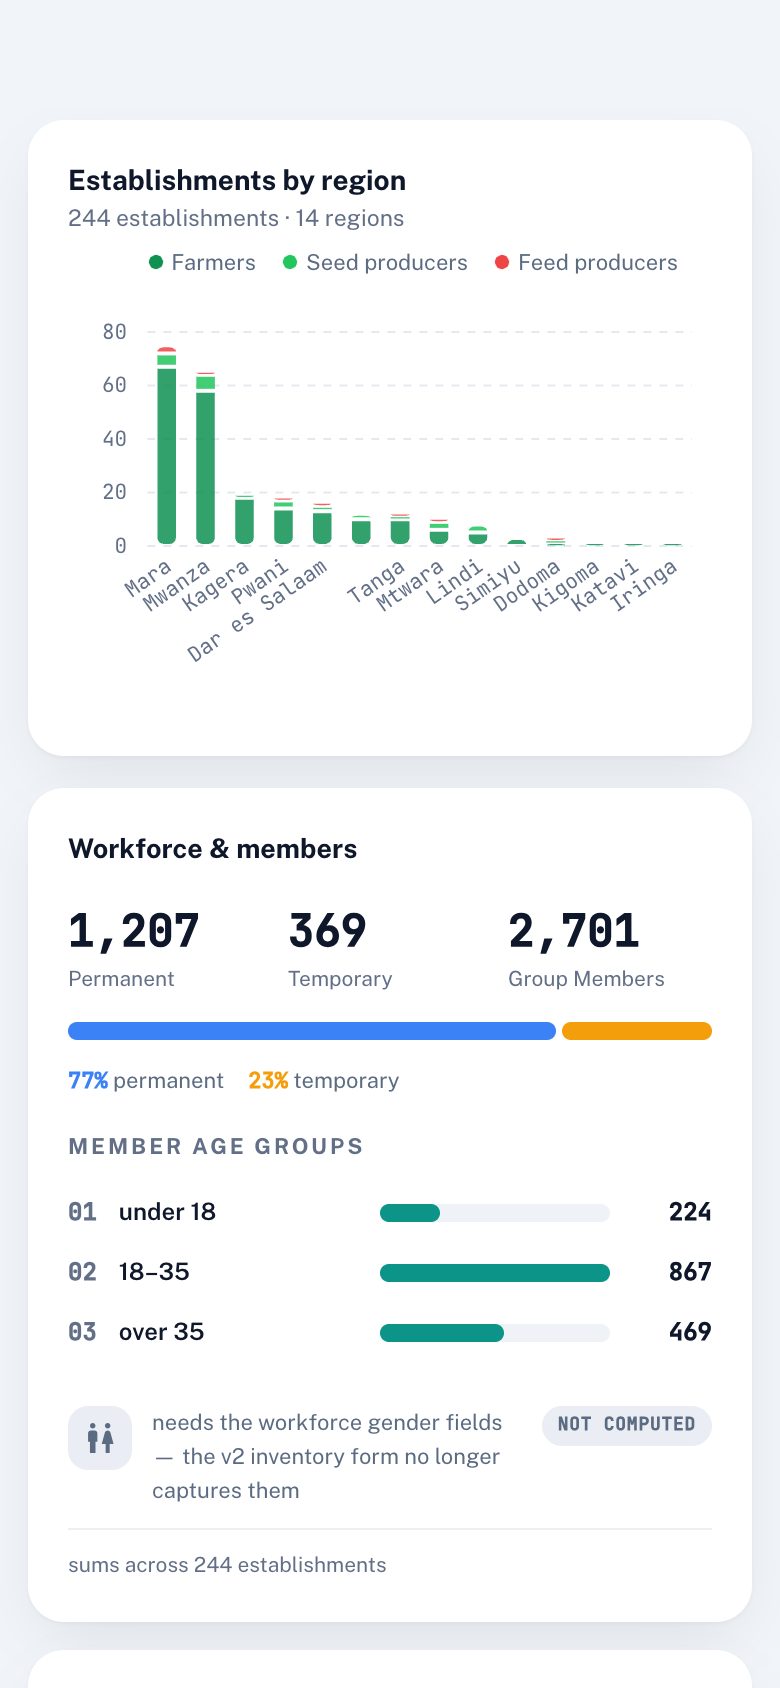
The aquaculture dashboard has five panels: an overview, production, seed, inventory and follow-up. Production covers output by system and species, pond structure, seed and feed sources, average costs, cycle length and seed mortality. Follow-up lists harvests that are due or overdue, worked out from each stocking date and cycle length.
Every average on the dashboard shows the number of records behind it. A mean price from four farms is worth less than one from forty, and the reader should be able to see which is which.
The map labels each measure by what kind of figure it is. Establishment counts are a census. Production is what farms reported. Yield per square metre, survival and price per kilogram are ratios, and a ratio is not shown for an area with fewer than three production cycles behind it.
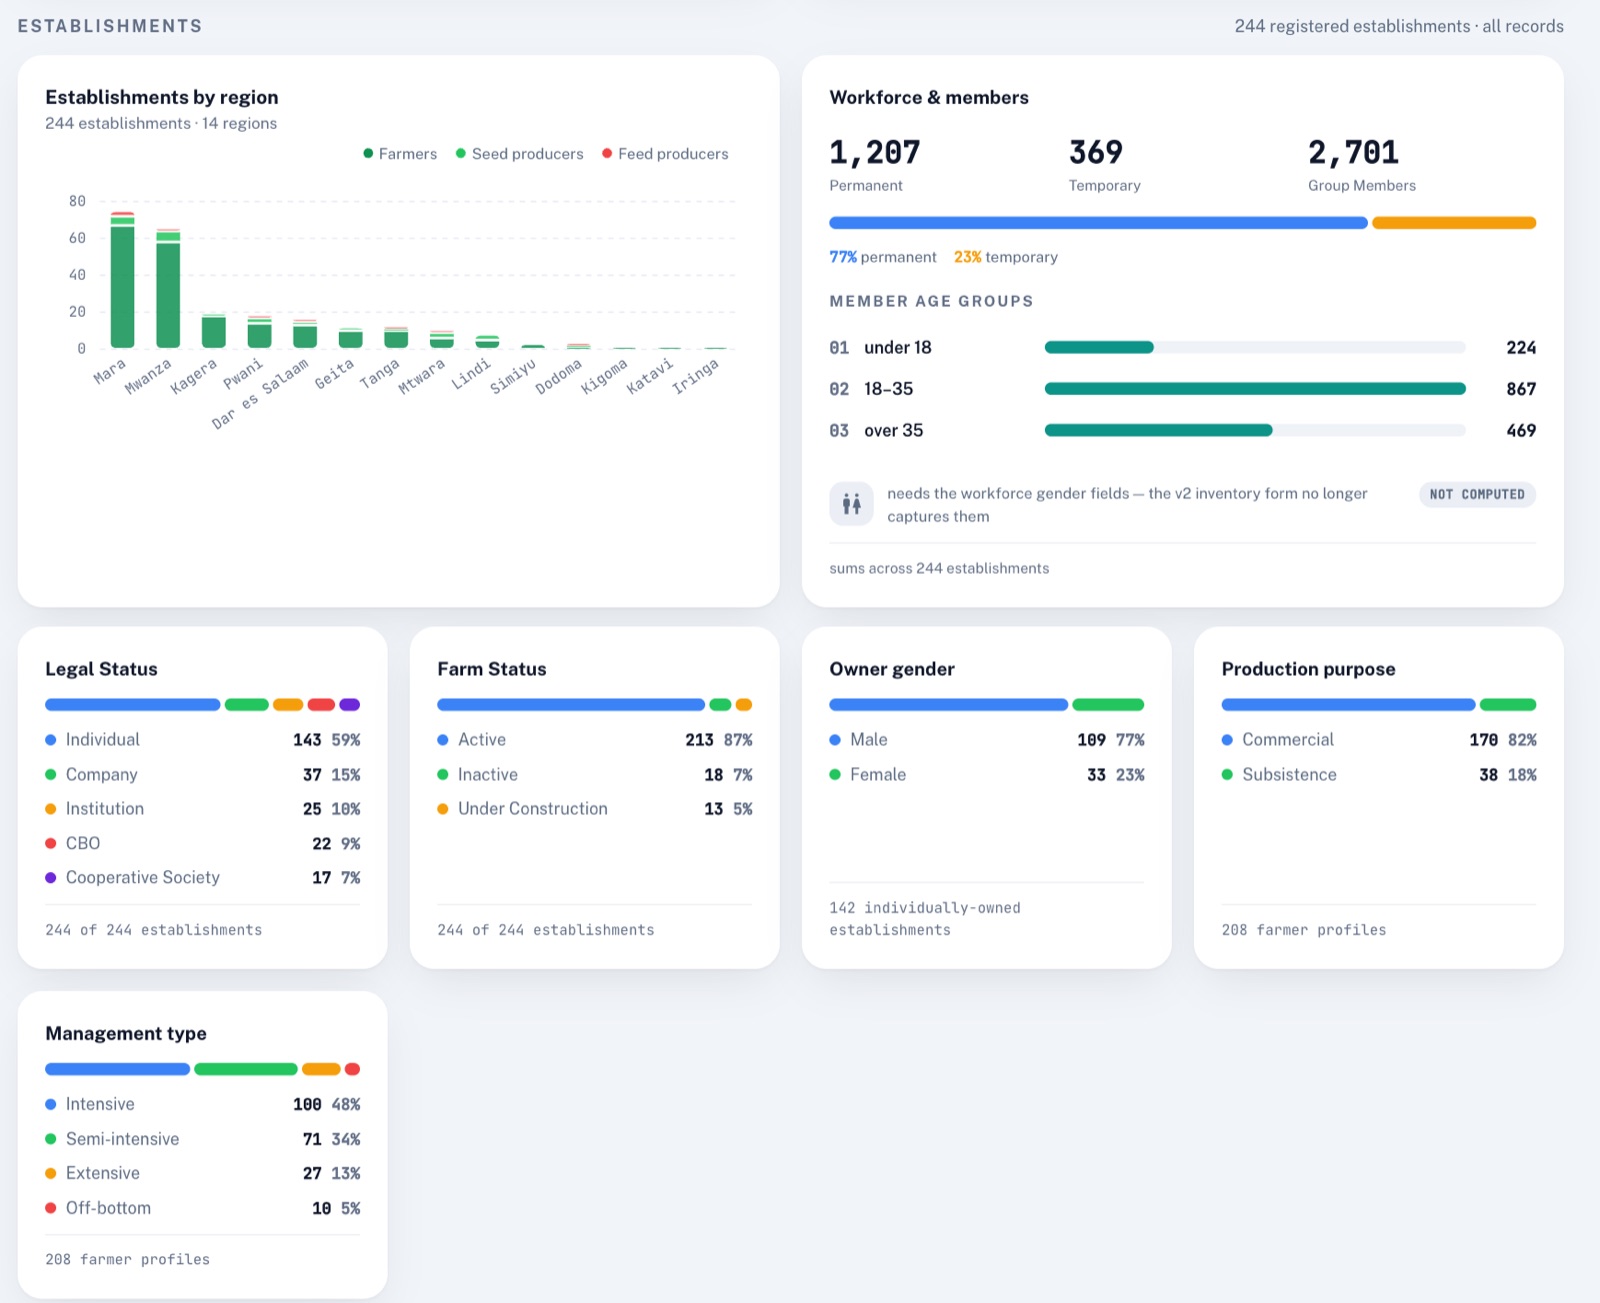
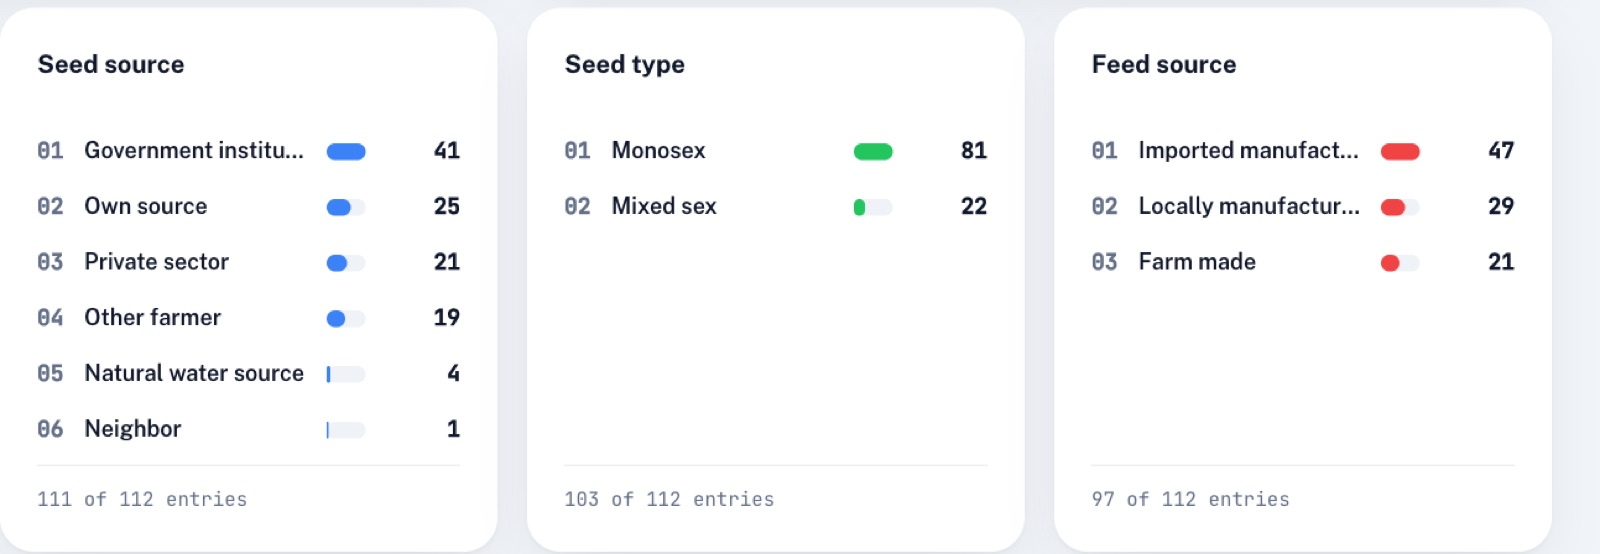
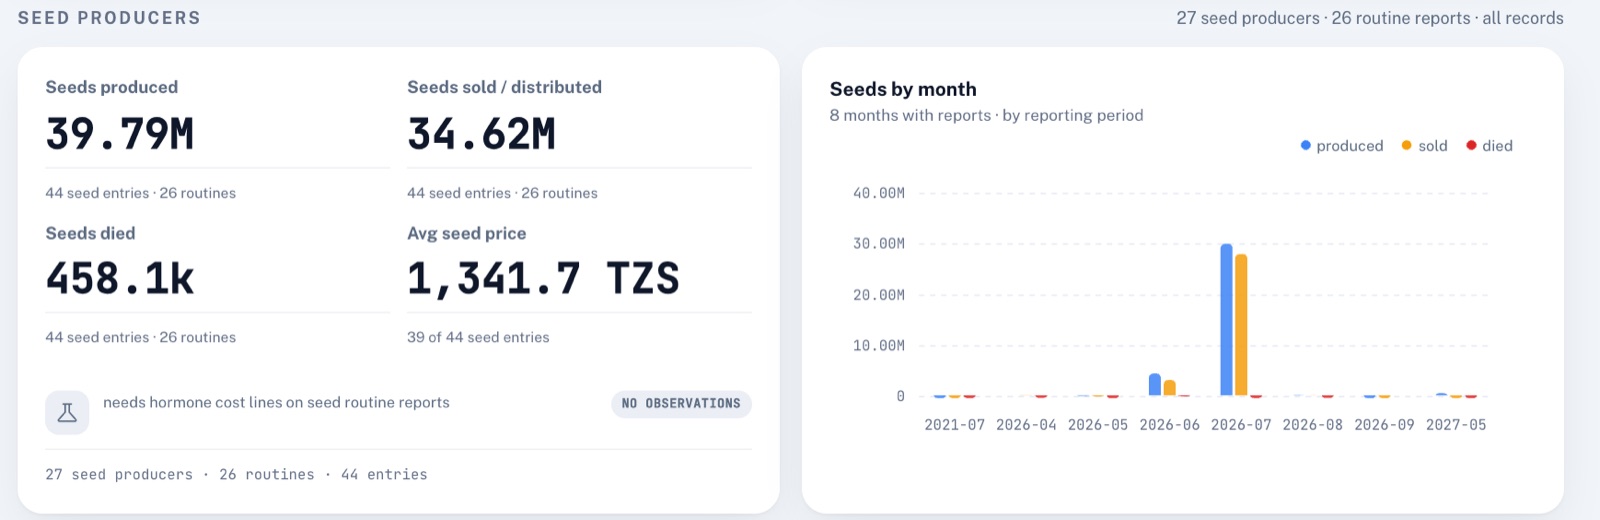
The production totals and the follow-up panels are not shown here. The first carries figures still being checked; the second names farmers and officers.
What stays private
The register holds owner names, phone numbers, national ID numbers, years of birth, investment amounts and the location of each farm. None of it leaves the platform. Figures published here are counts by region, type, system and species, and individual farms are never placed on a public map.
Results
Seaweed research monitoring
A separate pair of forms supports a TAFIRI study of new seaweed farming techniques and their effect on the surrounding ecosystem. A baseline form describes each study site: water quality, depth, substrate and the farmers involved. A monitoring form follows it weekly for water quality and every two weeks for nutrients, fish and benthic life, the health of each rope, scored for ice-ice disease, epiphytes and grazing, and growth from the weight of each rope over time. The forms are ready.