 FAIMS

Catch assessment survey
Enumerators meet boats as they land, weigh and price the catch, and ask how often the crew fished in the past week. FAIMS turns those samples into catch rates, then uses the frame survey's boat count to estimate total catch and value for every month, district and type of fishing unit.
- trips sampled
- 491,652
- earliest year on record
- 2002
- landing sites with catch records
- 751
- species recorded in the catch
- 396
What the survey measures
A catch assessment survey, CAS for short, answers four questions about a fishery each month. How much does a boat land on a day it fishes? How often do boats go out? Which species make up the catch? What is that catch worth at the beach?
Nobody can weigh every landing on Lake Victoria or along the Tanzanian coast. The survey samples a share of the boats at a set of landing sites, works out averages for each kind of boat, and scales them up with a census of the whole fleet. That census is the frame survey.
FAIMS follows the method in FAO’s handbook on sample-based fishery surveys (Stamatopoulos, 2002), the same approach behind FAO’s ArtFish and Open ArtFish software, and the harmonised CAS procedures that LVFO uses on Lake Victoria. The arithmetic is the same. What changes is the path the data takes. Enumerators enter records on Android phones at the landing site, the server checks each record as it arrives, and a month can be estimated as soon as it closes.
| Country | Water body | Trips sampled | Years |
|---|---|---|---|
| Tanzania | Indian Ocean | 113,389 | 2016 to 2026 |
| Kenya | Lake Victoria | 95,643 | 2005 to 2026 |
| Tanzania | Lake Tanganyika | 63,866 | 2015 to 2026 |
| Burundi | Lake Tanganyika | 61,378 | 2025 to 2026 |
| Uganda | Lake Victoria | 56,611 | 2005 to 2025 |
| Tanzania | Lake Victoria | 45,356 | 2002 to 2026 |
| DR Congo | Lake Tanganyika | 16,992 | 2025 to 2026 |
| Uganda | Lake Albert | 10,961 | 2020 to 2024 |
| Tanzania | Mara River | 5,597 | 2023 to 2025 |
| Zambia | Lake Tanganyika | 3,603 | 2025 to 2026 |
| Mauritius (Rodrigues) | Indian Ocean | 1,651 | 2025 to 2026 |
| Zanzibar (Tanzania) | Indian Ocean | 83 | 2026 |
Records before 2021 came from the system FAIMS replaced. About 80,000 records from 2002 to 2017 were imported from its database and kept as approved data, since no other copy of them exists.
Fishing units
A paddled dugout with one gillnet and a motorised sesse pulling a small seine have very different days on the water, so averaging them together would say little about either. CAS works per fishing unit instead: a craft type, how it is propelled, and its main gear.
The frame survey and every catch record build the unit code with the same rules, which is what lets the two be joined. Sesse canoes are the exception that needs care, because the same hull counts as a different unit depending on what drives it.
| Recorded as | Unit code | Example |
|---|---|---|
| Sesse canoe, pointed or flat-ended, with an outboard, sail or tow | SMS-<gear> |
SMS-GN |
| Flat-ended sesse with a paddle | SP-<gear> |
SP-LL |
| Raft, foot fisher or other | OT-<gear> |
OT-HL |
| Any other craft | <craft>-<gear> |
PC-GN or CA-LN |
| Indian Ocean, with craft grouping switched on | BOAT-<gear> or CANOE-<gear> |
BOAT-RN |
On the Tanzanian side of Lake Victoria the 2020 frame counted 7,959 paddled sesse longliners (SP-LL), 5,910 motorised sesse with small seines (SMS-SS) and 5,071 motorised sesse with gillnets (SMS-GN), among others. Each of these is estimated separately and added up at the end.
How many boats to sample
Landing sites are not drawn at random. A site is sampled because an enumerator is posted there. What FAIMS plans is how many boats of each unit the enumerator should sample at that site on a given day, based on how many the frame survey counted there.
- N
- fishing units of that type the frame survey counted at the site
- s
- sampling share, 0.20 unless the water body sets its own
For the Tanzanian part of Lake Victoria this gives 578 sites and a combined target of 6,876 boats a day. Nobody expects every site to be covered every day. The target is there so the day’s sample spreads across units in proportion to the fleet.
Progress counts submissions per site, day and unit and caps each one at its target. Twenty extra gillnet boats therefore cannot make up for a longliner nobody sampled. Supervisors see month-to-date progress and a list of sites below 80% of plan.
An enumerator can also enter a plan for the day by hand: the boats expected per craft and gear and how many they can sample. The app shares that sample across the expected units by largest remainder, giving each unit at least one boat when the sample is big enough. Managers can require a plan before the CAS form opens, but nothing rejects a record without one, so work done offline always syncs.
What the enumerator records
One CAS record is one sampled boat on one day. The form asks for the place, the boat, its gear and its trip, then a list of species with a count, a weight, a measuring unit and a price for each.
| Group | Fields | Used for |
|---|---|---|
| Place | Village, landing site, fishing ground, where the crew comes from | Strata, fishing ground and migrant fisher reports |
| Boat | Craft type, registration, length, propulsion, horsepower, crew and female crew | Fishing unit, effort profile |
| Gear | Gear type, number of gears, panels, size, baits, mode of operation, lamps and light source | Fishing unit, effort profile |
| Trip | Departure, start and end of fishing, return, hours fished | Effort profile only |
| Activity | Times fished with this gear in the past week | Fishing activity (PAB) |
| Catch | For each species: count, weight, measuring unit, price | Catch per trip, species split, value |
Fish often leave the beach by the basin or the bundle, not by the kilogram, so the form lets the enumerator record what is actually sold. FAIMS converts it.
| Measuring unit | Weight w | Price per kg |
|---|---|---|
| Kilogram | weight as recorded | price as recorded |
| Basin, bucket, tin, bundle, box, basket or sack | count × kg per unit | price per unit ÷ kg per unit |
| No unit, dagaa or haplochromines | count × kg per unit | price per unit ÷ kg per unit |
| No unit, Indian Ocean | total weight | recorded value ÷ weight |
Checks before a record counts
A typing slip of one decimal place turns 40 kg into 400 kg and can double a district’s estimate. FAIMS checks records twice: on the phone while the enumerator is still with the crew, and again on the server.
-
Boat capacity and crew
The total catch cannot exceed what that craft type can carry, and the crew must fall inside the craft's usual range.
-
Price per kilogram
The price is converted to currency per kg and compared with the band for that species and measuring unit, looked up for the landing site, then the district, then the country. Outside the 10th to 90th percentile the app asks the enumerator to confirm. Above twice the usual maximum the server refuses the record.
-
Catch weight and catch per trip
Bands are kept for each country, water body, species and fishing unit, built from records since 2019. Unusual values need confirmation, and the phone will not accept a catch above five times the historic upper edge. When an enumerator confirms a warning, the band they saw is saved with the record.
-
Quality status
Only approved records reach estimates, dashboards and reports. If the checker is unavailable the record is saved as needing review and stays out until someone looks at it. Editing a record runs the checks again; deleting it removes everything derived from it.
-
Corrections in batches
For records already saved, FAIMS proposes corrections it can justify: a price off by a factor of ten, or a weight that only fits the boat's capacity after one power-of-ten change. Proposals of the same kind are grouped, a reviewer checks a sample of each group, and only then can the group be applied. Every applied change can be rolled back and is verified afterwards.
- n
- proposals in a correction group; groups of four or fewer are checked in full
In October 2026 there were about 3,500 catch-weight bands, 3,500 catch-per-trip bands and 2,000 price bands in use. Of 490,415 CAS records, 22 were waiting for review.
Catch per trip
The catch of a sampled boat is the sum of its species lines, after converting each to kilograms. Catch per unit of effort, CPUE, is that same figure: kilograms landed per fishing unit per fishing day.
- w(i)
- weight of species line i on trip t, in kg
Hours fished are recorded but left out on purpose. A trip counts as one boat-day, and how often boats go out is handled separately through fishing activity, below.
Trips are then grouped by month, district and unit. The mean comes with a 90% confidence limit built from a Student t table stored in the database.
- d, u, m
- district, fishing unit and month: the stratum
- n
- trips sampled in the stratum
- SD
- sample standard deviation of CPUE
- t₉₀
- two-sided 90% Student t value: 6.31 at one degree of freedom, 1.72 at twenty
With a single trip there is no t value, so the limit comes out as zero. A stratum built on one or two boats is therefore less certain than its interval suggests.
Fishing activity
Not every boat in the frame fishes every day. Each crew is asked how many times they fished with this gear in the past week. Dividing by seven gives the probability that a boat of this kind is active on any day, known as PAB.
- D
- times fished with this gear in the past week
- N
- units of type u at landing site s in the frame
- Dm
- calendar days in month m
- E
- fishing days, or boat-days of effort
In 2016 and 2017 the form also asked whether the boat fished yesterday (Y) and the day before (B). For those trips PAB is (1 + Y + B + D) / 10. The questions were later dropped, so every trip since uses D / 7.
Activity is pooled across all sampled sites in a district, so a site nobody visited that month borrows the activity of its neighbours.
Raising the sample to total catch
Total catch for a landing site, unit and month is the number of units in the frame, times the share that fish on a given day, times the days in the month, times the catch of a boat on a fishing day.
- Catch
- tonnes landed at site s by units of type u in month m
- s, d
- landing site and the district it sits in
- u, m
- fishing unit and month
Every landing site in the frame is raised, including sites nobody visited that month, using the activity and catch rate of its district. A unit that appears in the frame but was not sampled in that district and month gets no estimate. FAIMS does not fill the gap, so a thin month shows up as missing catch rather than invented catch.
Species and value
The raised total is split by species in the proportions the sampled boats landed, and each species is valued at its mean beach price.
- W(k)
- sampled weight of species k, from lines with a price and a weight
- W
- all sampled weight of the unit in that district and month
- P(k)
- mean price per kg of species k in the same lines
Lines without a price count in W but not in any W(k). Species totals therefore add up to a little less than the unit’s total whenever some fish went unpriced, usually fish taken home to eat. Value is reported in thousands of the country’s own currency, so regional figures need a single currency before they can be added.
The CAS dashboard
Supervisors and managers start on the CAS dashboard. For one water body and one month it shows the estimated catch and value, the number of species, craft, gears, enumerators, sites and fishing units against the month before, sampling progress against the daily plan and the sites furthest behind, catch per trip by fishing unit, and the species composition of the landed weight.
Further down come the fishing grounds the catch came from, which landing sites have gone quiet, the effort profile of the fleet across all records, and the state of data quality.
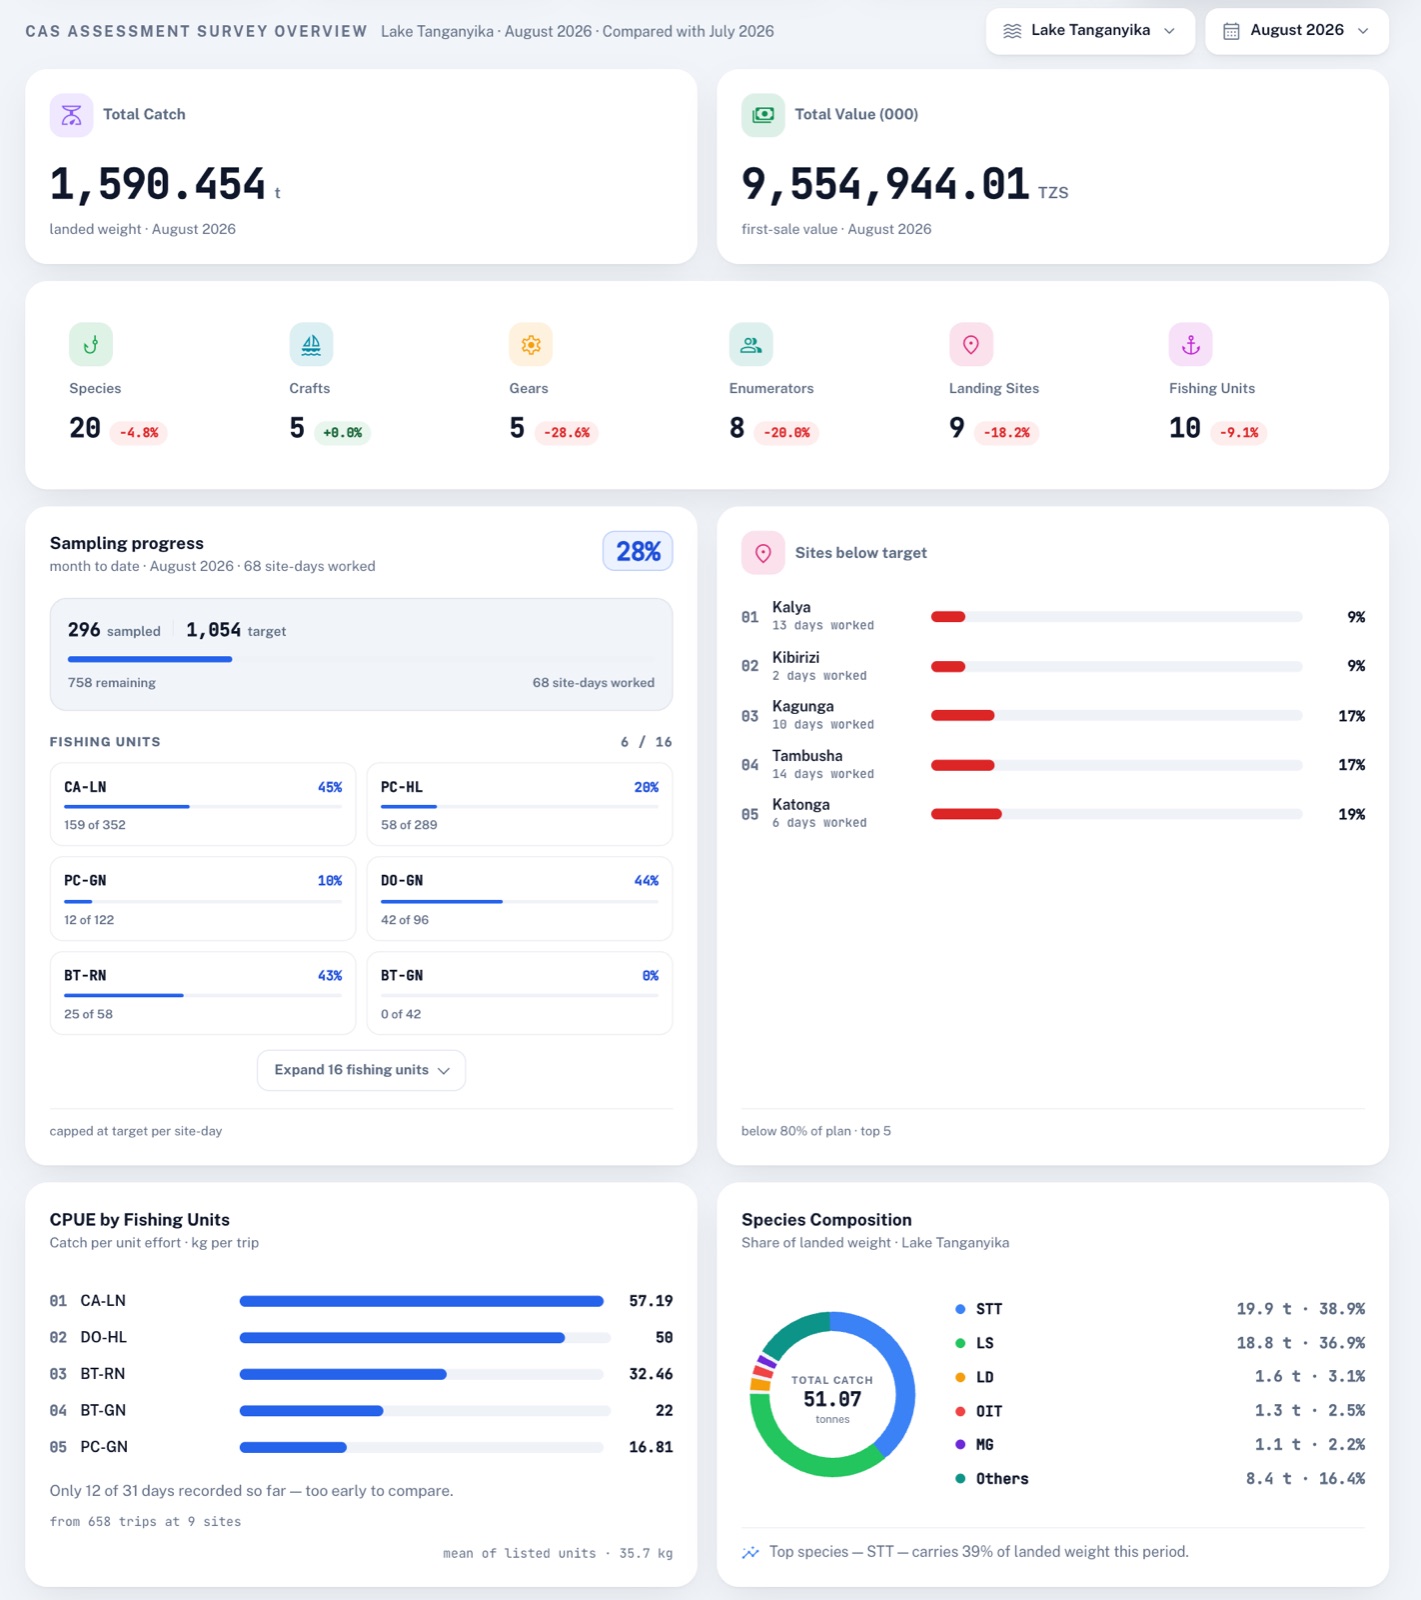
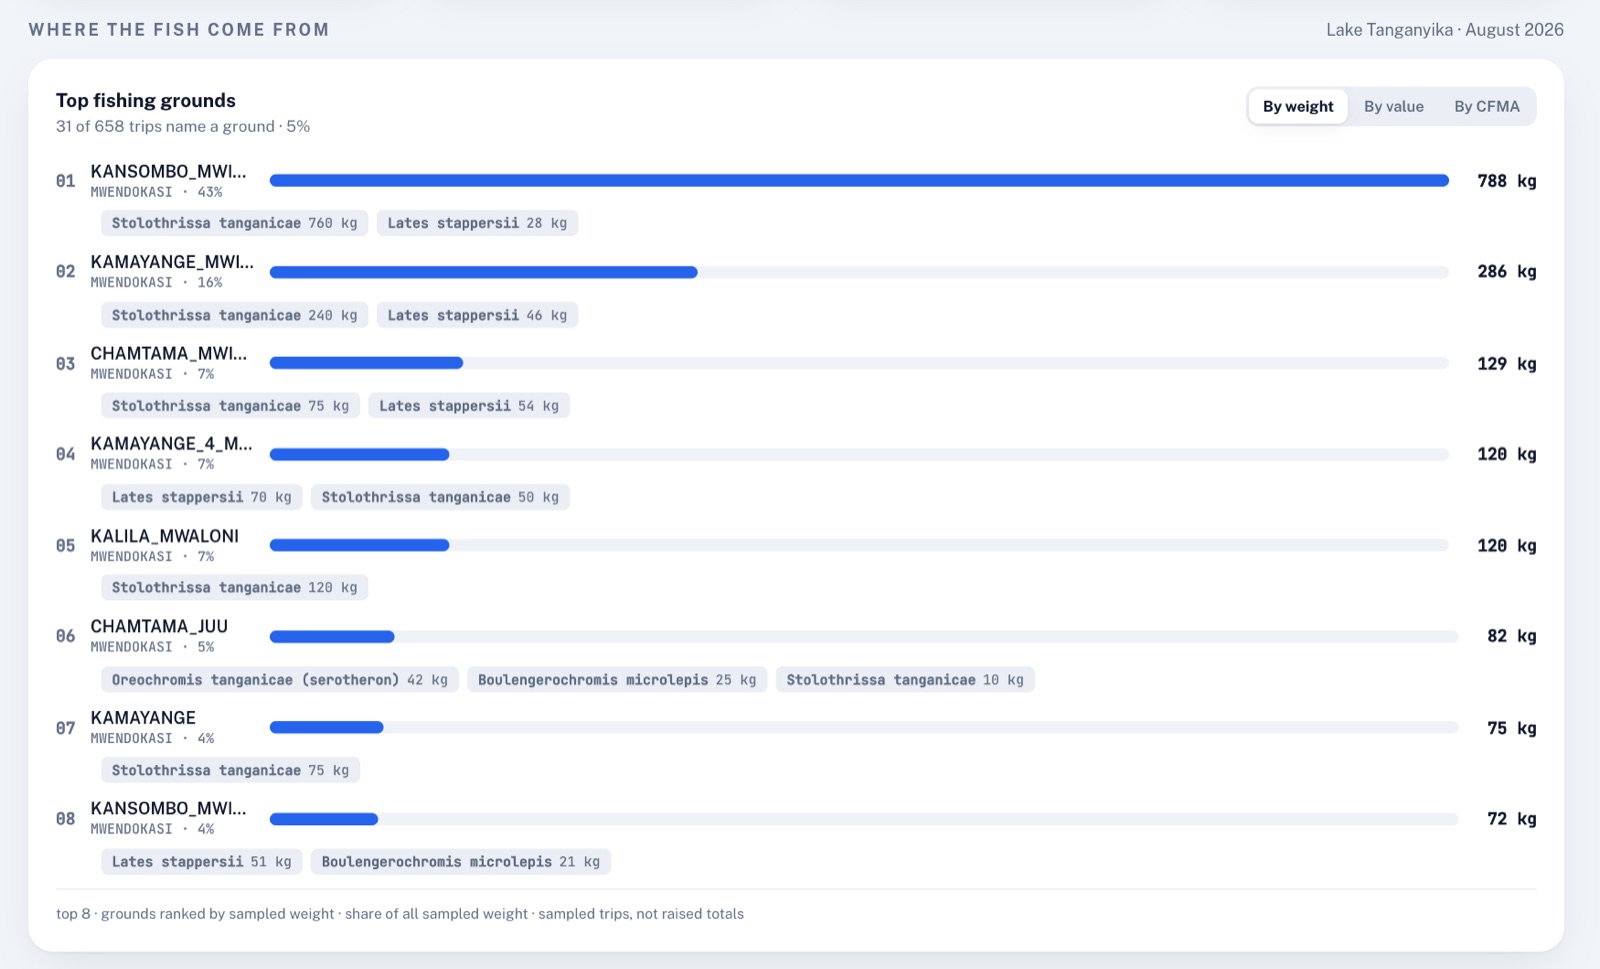
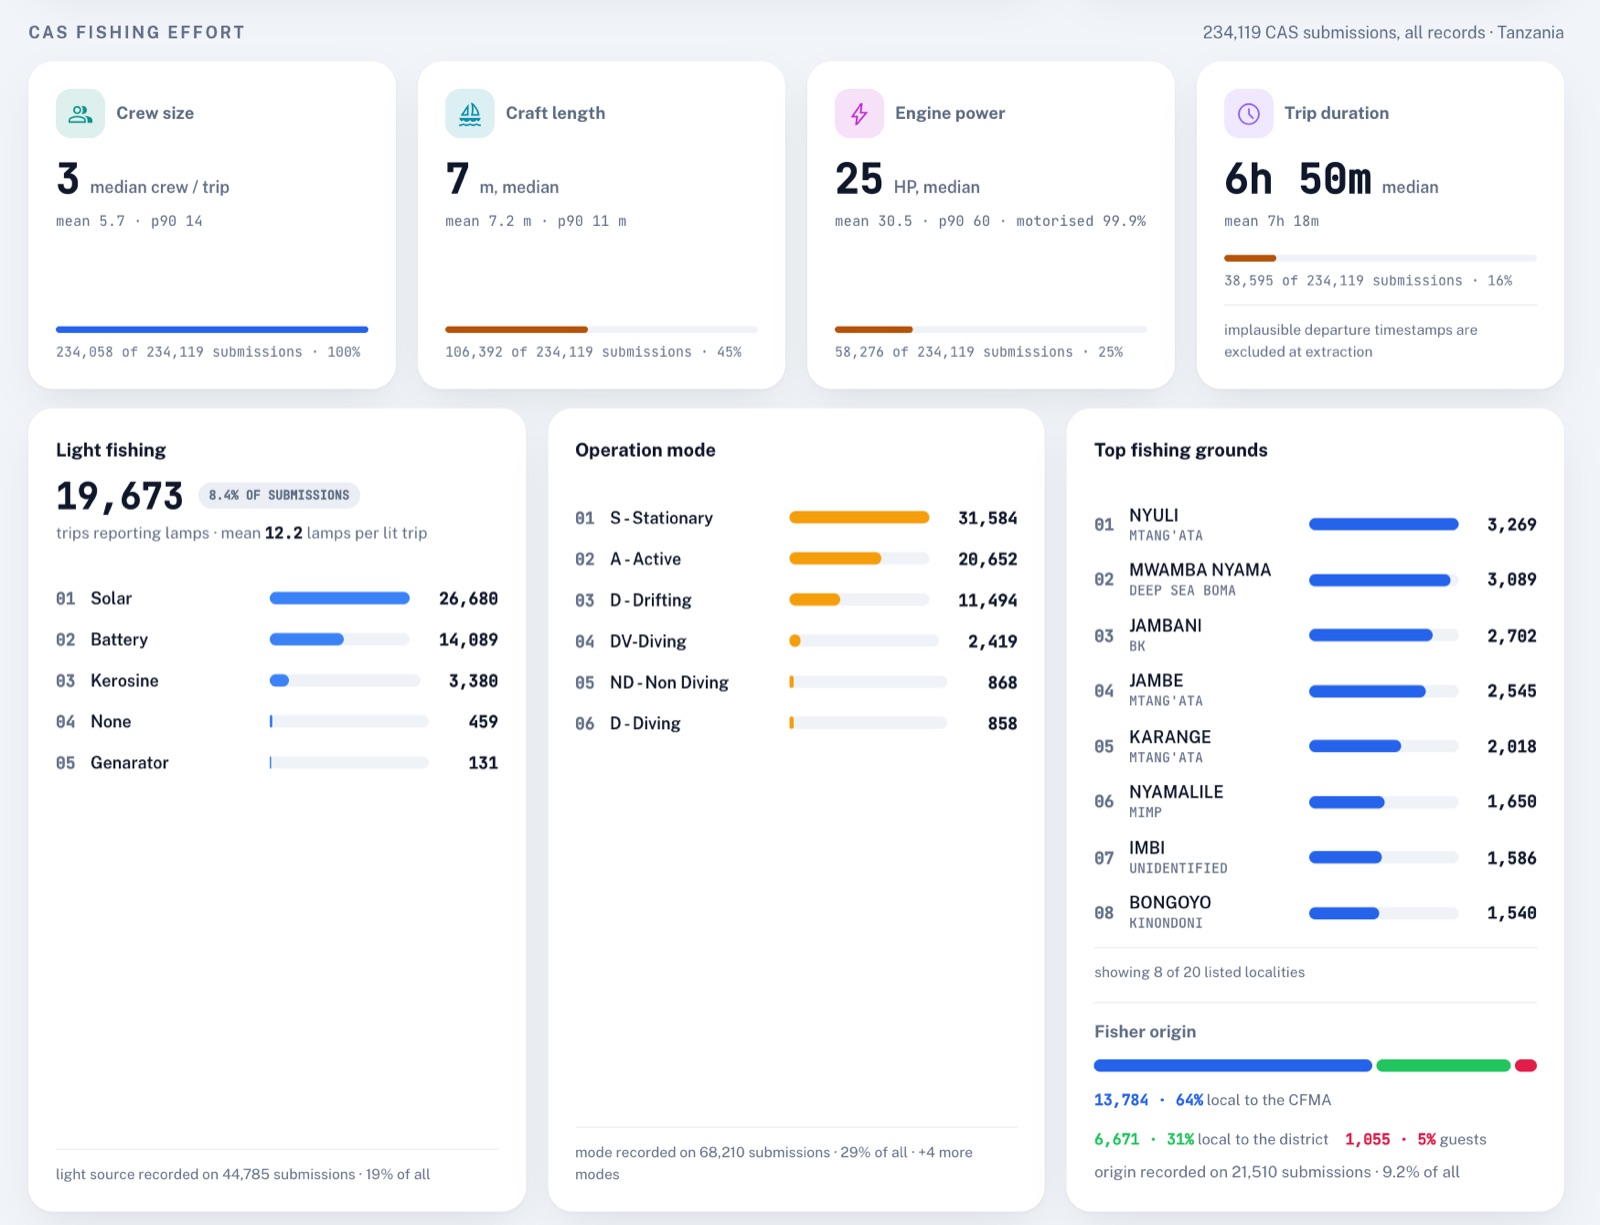
The panels that list enumerators by name and the delivery log of notifications are left out of these screenshots.
The query runner
Analysts reach every table on this page through one screen, the CAS query runner. Behind it is a single endpoint that takes a water body, an optional region and district, a period and the name of a query, and returns a table.
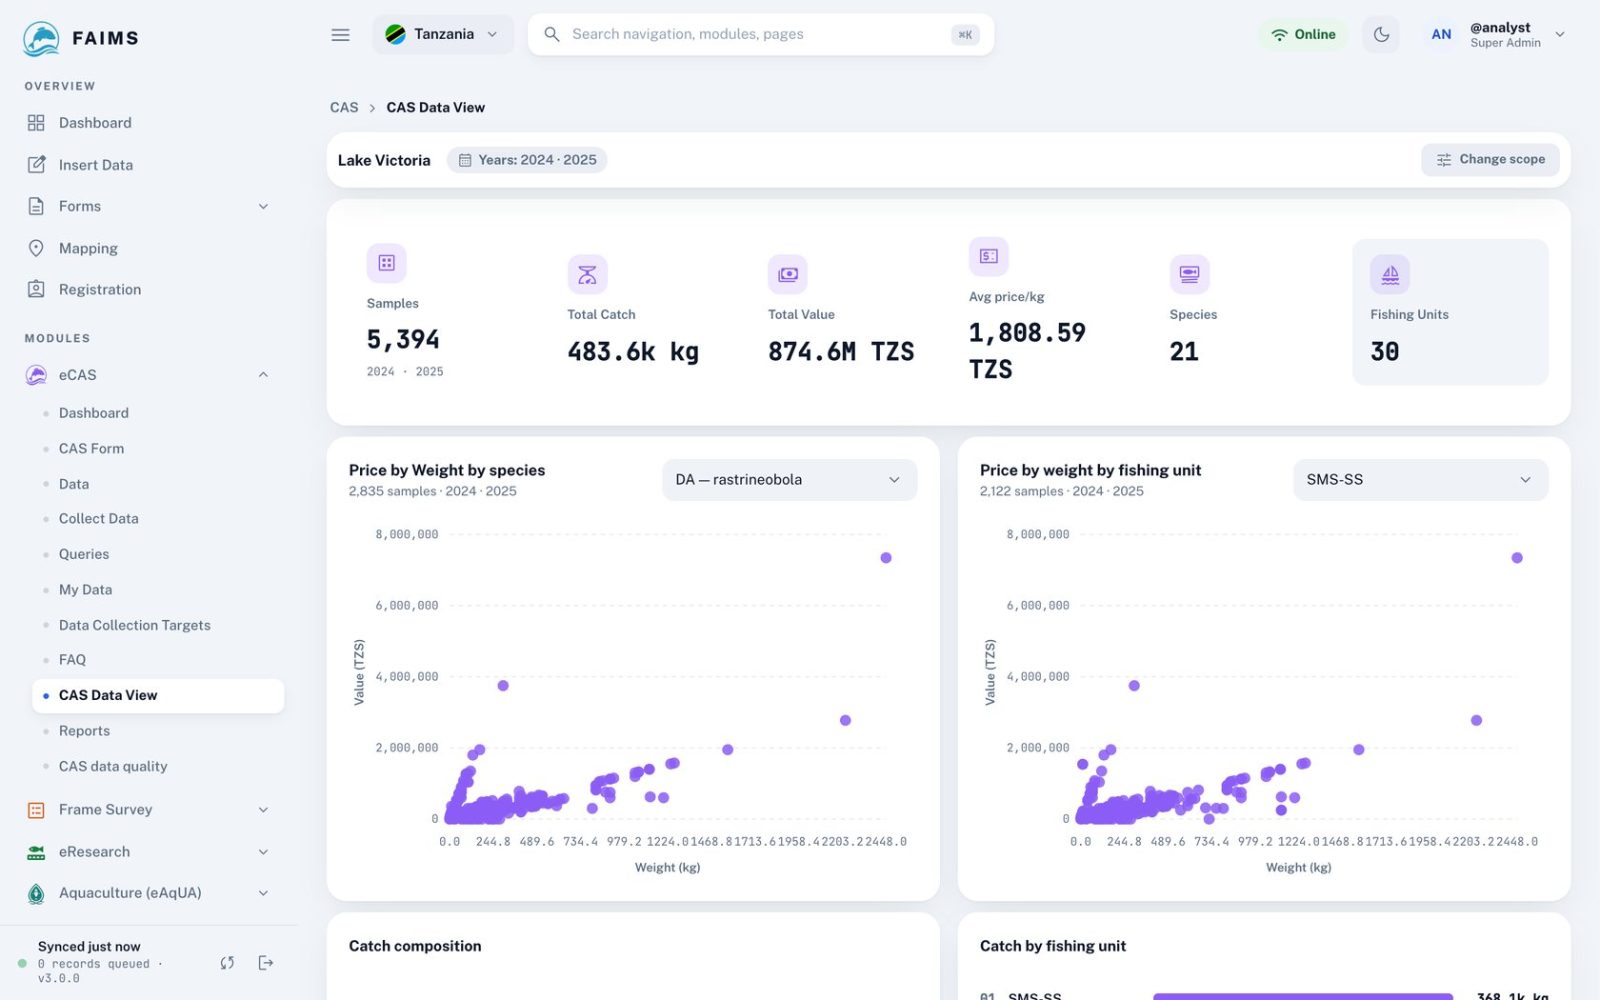
- Four ways to set the period: years and months, a monthly report, a comparison between years, or any date range.
- Two families of query. The FAO family is the chain described above. The regular family holds sampled summaries and older reports.
- Regions and districts follow the boundaries in force in the year of each record, so a district split in 2024 does not move records from 2019.
- Every query is limited to the user’s country. District fisheries officers see only their own district’s landing sites.
- Requests that would pull too many rows are refused with a message instead of running for minutes. The two queries that only read the frame survey skip the catch records altogether.
- Results are cached for ten minutes per combination of filters, craft grouping and user scope.
- Search, sorting and paging run on the server. Every table downloads as CSV and comes with a short summary written from its own numbers, without AI.
| Kind | Examples |
|---|---|
| From the sample | Daily CPUE by fishing unit. Average CPUE by unit, landing site and month with relative error. PAB per sampled unit. Species composition. Catch by fishing ground. Migrant fishers by landing site. |
| Raised | Total catch with PAB by unit and district. Catch and value by region, district, landing site, unit or species, per year or per month. Annual fishing days. Catch per boat-day by species. |
| From the frame | Fishing units per landing site. Fishing units per district. |
| Cross-checks | Units sampled and CPUE against units in the frame, by district and month. |
The same figures feed the Report Builder, which drafts monthly, quarterly, annual and regional CAS reports in the layout of the LVFO regional synthesis. A language model writes the narrative from figures FAIMS has already computed. Every number in the draft is checked against those figures, the methodology section is fixed text, and nothing is published until a person approves it.
Results
Figures are refreshed from FAIMS every night. They are provisional and not for citation. Trips above 5,000 kg are left out. A year is raised only when it has data for every month, at least 2,000 trips, and sampled units covering 40% of the fleet. The results page has the landing-site map and beach prices.
Status of the estimates
Things to keep in mind when reading a raised table:
- A stratum with one trip shows no interval at all.
- Relative errors in aggregated tables are averages of their parts, not combined variances.
- A query applies one frame year to every month in it, so a comparison between 2016 and 2025 uses the same fleet count for both.
- Units that were not sampled are left out, not imputed.
- A trip with no answer to the days-fished question enters the activity mean as zero.
References
- Stamatopoulos, C. (2002). Sample-based fishery surveys: a technical handbook. FAO Fisheries Technical Paper 425. Rome, FAO. fao.org
- FAO. Open ArtFish: approaches, rules and techniques for fisheries statistical monitoring. Software and database for estimating catch and value from sample surveys of small-scale fisheries. fao.org
- LVFO (2019). Standard operating procedures for catch assessment surveys on Lake Victoria. Lake Victoria Fisheries Organization, Jinja.
- LVFO (2022). Regional catch assessment survey synthesis report, June 2021. Lake Victoria Fisheries Organization, Jinja.